Overview
This article will show you how to capture debug logs to aide technical support in diagnosing and resolving any technical issues
Log into Encoder or Decoder Web UI
Logs are captured from the Web UI of the Encoder or Decoder in question. You can either access this by clicking on the unit in the N-Able software, or by entering the IP address of the device into your web browser.
When prompted in your browser, enter the login credentials (default is admin/password).
N-Able automatically logs into the Web UI as it stores the credentials within its settings.

Logs page
The Logs page can be found from the menu at the top of the main page, often located under the 'More' drop down menu


Start Debug Log
To begin logging, click on 'Start Debug Log' and wait for the log event showing debugMode:on. This indicates the logs are now running and will capture any events happening on the device.

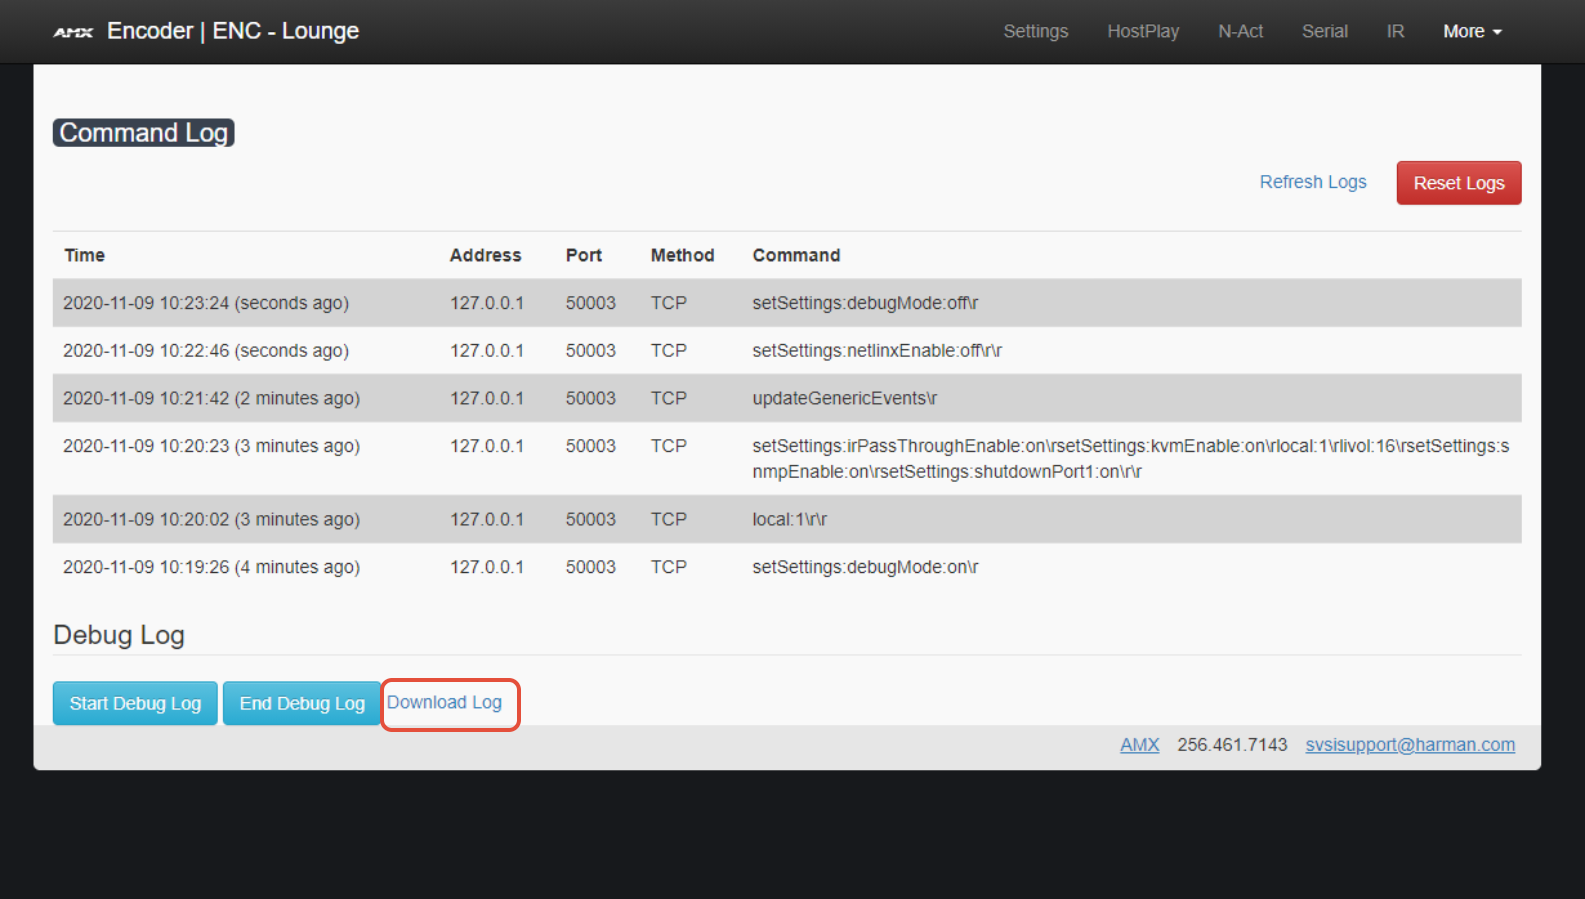
End and download Debug Log
Once you have finished capturing the logs, whether this be a few minutes, or a few days, you should now see a number of events shown in the Command Log.

Click on 'End Debug Log' and wait for 'Download Log' to be shown next to it.
You can now click this to download it. It will be saved to your laptop's Downloads folder as DebugLog.bin.
Once downloaded, send this to [email protected] referencing your ticket number. Logs will then be provided to AMX engineering for review and feedback.
Note: If a device is rebooted, you will need to repeat these steps to re-enable and capture the logs.